Exploration: Building Tomorrow’s Reserves Today

At Hecla Mining, exploration is the cornerstone of our sustainable growth strategy. With over $22 million allocated for exploration in 2025, we’re committed to expanding our resource base through systematic, data-driven discovery across our extensive land portfolio in North America’s most prolific mining districts.

Our Exploration Philosophy

Hecla’s exploration success is built on:

  • Deep Geological Understanding: Leveraging decades of operational expertise and comprehensive deposit models
  • Systematic Approach: Following a disciplined pipeline from target delineation through resource definition
  • Strategic Land Position: Controlling prime real estate in historically productive districts with proven mineralization
  • Modern Technology: Integrating advanced geophysics, 3D modeling, and data analytics with traditional prospecting

2025 Exploration Focus

Our 2025 exploration program strategically allocates resources to maximize discovery potential.

Why Exploration Matters at Hecla

Sustainable Growth: Our systematic exploration approach has consistently replaced and grown reserves at operating mines, ensuring long-term production stability

Discovery Track Record: Recent successes include Bermingham and Flame & Moth at Keno Hill, Green Racer Sinter at Midas, and multiple high-grade intercepts across our portfolio

Infrastructure Leverage: Existing mills and permitted facilities at Midas, Aurora, and other sites dramatically reduce capital requirements and accelerate timeline to production

Prime Real Estate: Our land positions encompass some of North America’s most endowed precious metals districts, many consolidated under single ownership for the first time

Technical Excellence: As one of North America’s leading precious metals producer, Hecla combines 134 years of mining expertise with cutting-edge exploration technology and data analytics

Value Creation: Every dollar invested in exploration targets long-term shareholder value through resource growth and discovery potential

Risk Mitigation: Diverse portfolio across multiple jurisdictions and deposit types provides balanced exposure and multiple paths to growth

San Juan Silver

Creede, Colorado

San Juan Silver (1% of exploration budget)

  • Historic Significance: First time the entire Creede Mining District (21 square miles) is under single ownership, representing one of Colorado’s most prolific silver districts with 84+ million ounces historic production
  • Bulldog Mine Focus:
    • Inferred Resource: 38 Moz silver, 49,400 tons lead, 39,850 tons zinc
    • Historic production of 25 million ounces silver (1969-1985)
    • Strategic advancement toward accessing underground infrastructure for resource confirmation and expansion
  • Exploration Success: 2013 surface drilling intersected high-grade mineralization 1,400 feet north of Bulldog workings, confirming district-scale potential
  • Comprehensive Approach: 30 miles of permissive strike length along known mineralized structures
  • Community Partnership: 13-year track record of environmental stewardship and stakeholder collaboration
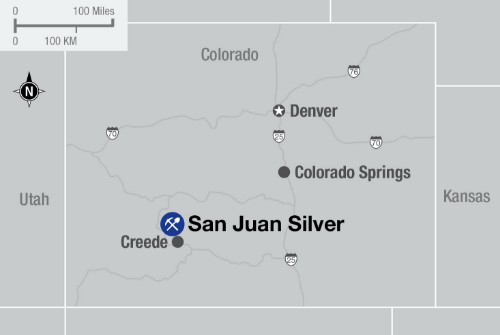
A map of San Juan Silver.

Resources

Information with respect to measured, indicated, and inferred resources is set forth below.

Mineral Resources
(As of December 31, 2024 unless otherwise noted)
Tons(000)Silver(oz/ton)Gold(oz/ton)Lead(%)Zinc(%)Silver(000 oz)Gold(000 oz)Lead(Tons)Zinc(Tons)

Inferred Resources (12,25)

2,351

15.8

0.01

1.4

1.1

37,026

27

47,430

38,020

Note: All estimates are in-situ. Resources are exclusive of reserves.

(12) Mineral resources are based on $2,000/oz gold, $24/oz silver, $1.15/lb lead, $1.35/lb zinc and $4/lb copper, unless otherwise stated.

(25) Inferred resources reported at a minimum mining width of 6.0 feet for Bulldog and an NSR cut-off value of $200/ton and 5.0 feet for Equity and North Amethyst veins at an NSR cut-off value of $175/ton; Metallurgical recoveries based on grade dependent recovery curves; metal recoveries at the mean resource grade average 89% silver, 74% lead, and 81% zinc for the Bulldog and a constant 85% gold and 85% silver for North Amethyst and Equity.

Nevada

USA

Silver Valley/Star

Wallace, Idaho

Silver Valley, Idaho (9% of exploration budget)

  • Renewed Emphasis: Initiating expanded exploration across our extensive land package in one of the world’s most prolific silver districts
  • Unparalleled Historic Production: Five mines exceeding 30 Moz silver each, with cumulative district production surpassing 500 Moz
  • Full Pipeline: Targets ranging from along-strike and down-dip extensions of existing ore deposits to untested geochemical anomalies
  • Lucky Friday Focus: Leveraging refined structural models from 2024 drilling that significantly improved understanding of mineralization controls
  • Organic Growth Vision: Despite extensive historic production, the ground remains highly prospective for new discoveries


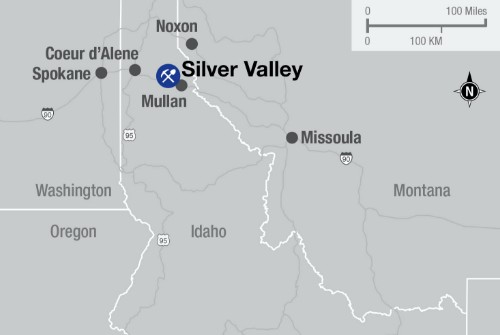
A map of Silver Valley

Resources

Information with respect to measured, indicated, and inferred resources is set forth below.

Mineral Resources
(As of December 31, 2024 unless otherwise noted)
Tons(000)Silver(oz/ton)Gold(oz/ton)Lead(%)Zinc(%)Silver(000 oz)Gold(000 oz)Lead(Tons)Zinc(Tons)

Measured Resources (12,23)

Indicated Resources (12,23)

834

3.4

7.2

8.5

2,820

60,120

70,450

M&I Resources (12,23)

834

3.4

7.2

8.5

2,820

60,120

70,450

Inferred Resources (12,23)

2,044

3.5

6.7

6.7

7,129

137,040

137,570

Note: All estimates are in-situ. Resources are exclusive of reserves.

(12) Mineral resources are based on $2,000/oz gold, $24/oz silver, $1.15/lb lead, $1.35/lb zinc and $4/lb copper, unless otherwise stated.

(23) Indicated and Inferred resources at the Star property are reported using a minimum mining width of 4.3 feet and an NSR cut-off value of $200/ton; Metallurgical recovery: 93% for silver, 93% for lead, and 87% for zinc.

Washington, USA

Republic, Washington

Republic, Washington (1% of exploration budget)

  • State Champion: Washington’s largest historic gold producer
  • Strategic Coverage: 3,583 acres encompassing all major productive trends including Knob Hill, Surprise, Lone Pine-Last Chance, Tom Thumb, and Golden Promise
  • Hidden Potential: Significant prospective terrain concealed by post-mineral cover expands exploration search space
  • Modern Revival: Integration of historical datasets with 3D modeling and contemporary exploration tools
  • Recent Validation: Multiple high-grade gold intercepts confirm potential for both underground and bulk-tonnage discoveries
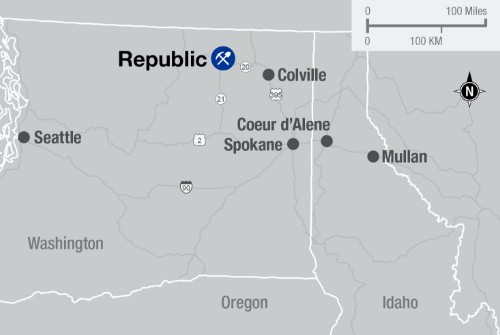
A map of the Republic of Washington

Heva-Hosco

Rouyn-Noranda, Quebec

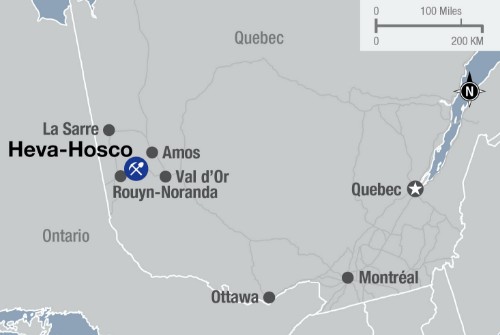
The advanced stage Heva-Hosco exploration property is located in the Joannes Township, 20 km (12.4 miles) east of Rouyn-Noranda. The property is up to 3 km wide (1.8 miles) and extends east-west for more than 8 km (5 miles) along the Cadillac-Larder Lake break (fault). The property is located in the Abitibi region near several world class gold mines as Laronde gold massive sulfide deposits and Canadian Malartic open pit and underground gold mines. The project comprises 102 mining claims covering 3,847 hectares (14.8 sq. miles). The property hosts two distinct gold deposits, the free-milling (gold, pyrrhotite, pyrite) mineralization at the Heva deposit, and the refractory (gold, arsenopyrite, pyrrhotite, pyrite) mineralization at the Hosco deposit.

The mining district along the Cadillac-Larder Lake break in the Abitibi region has high potential for new discoveries. Past exploration drilling only covers approximately one thousand feet down plunge of the break, leaving the depth of extension of known mineralization open at depth along the strike.

Since 2014 significant high-grade zones have been identified. Future exploration will target these mineralized zones at depth to upgrade the project by increasing the value of the free milling resources at Heva and Hosco North lens.

A map of Heva Hosco.

Resources

Information with respect to measured, indicated, and inferred resources is set forth below.

Mineral Resources
(As of December 31, 2024 unless otherwise noted)

Heva

Tons(000)Silver (oz/ton)Gold(oz/ton)Lead(%)Zinc(%)Silver(000 oz)Gold(000 oz)Lead(Tons)Zinc(Tons)

Measured Resources (22)

Indicated Resources (22)

1,208

0.05

62

M&I Resources (22)

1,208

0.05

62

Inferred Resources (22)

1,615

0.08

136

Hosco

Tons(000)Silver (oz/ton)Gold(oz/ton)Lead(%)Zinc(%)Silver(000 oz)Gold(000 oz)Lead(Tons)Zinc(Tons)

Measured Resources (22)

Indicated Resources (22)

32,152

0.03

1,907

M&I Resources (22)

32,152

0.03

1,097

Inferred Resources (22)

14,460

0.03

461

(22)Mineral resources at Heva and Hosco are based on a gold cut-off grade of 0.011 oz/ton (0.37 g/tonnes) for open pit and 0.117 oz/ton (4 g/tonne) for underground and metallurgical recoveries of 95% for gold at Heva and 81.5% and 87.7% for gold at Hosco depending on zone. Heva and Hosco resources are diluted 20% and reported using a 7% mining loss.

Opinaca/Wildcat

James Bay, Quebec

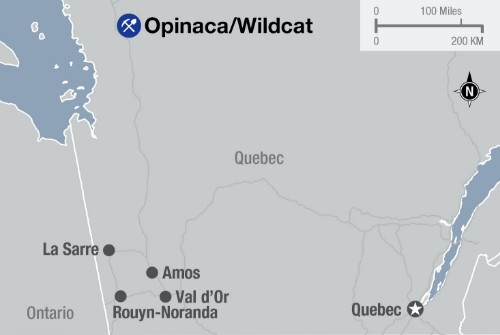
The Opinaca-Wildcat project is located 320km (199 miles) north of the city of Matagami, in the James Bay territory. The project consists of two properties: the Opinaca property and Wildcat property. Together these two properties comprise 565 claims covering an area of 29,547 hectares (114.1 sq. miles) near Goldcorp’s Eleonore Mine property, a world-class lode gold type deposit that contains over 9 Moz. at 0.18 oz/ton gold. Both the Opinaca and Wildcat properties cover a highly prospective area and straddle the contact between the Opinaca and La Grande subprovinces, which is the regional gold metallotect in the James Bay area.

Several different styles of gold mineralization have been defined on the Opinaca and Wildcat properties. The main styles of gold mineralization are: Pyrrhotite dissemination within calc-silicate alteration zones, Arsenopyrite and tourmaline-bearing strain zones, Garnet-pyrrhotite-rich bands, Pyrrhotite and pyrite dissemination in silicified bands and Arsenopyrite and native bismuth dissemination in tourmaline-garnet-rich pegmatitic intrusions.

Future exploration is planned, consisting of prospecting and trenching the known gold favorable structure and continuing to compile geological data as lithogeochemistry, geophysic and structure to increase the knowledge of the geology for future discoveries.

A map of Opinaca/Wildcat

San Sebastian

Durango, Mexico

  • District Scale: 162 square miles (42,000 hectares) hosting Francine Vein, Hugh Zone, Middle Vein, El Toro, and Don Sergio-Andrea systems
  • Proven Production: Current operations validate district potential
  • Pipeline Development: Multiple underexplored targets identified through systematic evaluation
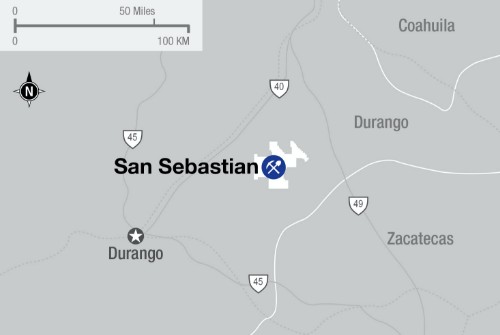
A map of San Sebastian

Resources

Information with respect to Inferred Mineral Resources is set forth below.

Mineral Resources
(As of December 31, 2024 unless otherwise noted)
OxideTons (000)Silver (oz/ton)Gold (oz/ton)Lead (%)Zinc (%)Copper (%)Silver (000 oz)Gold (000 oz)Lead (Tons)Zinc (Tons)Copper (Tons)

Measured Resources (17)

Indicated Resources (17)

1,233

6.6

0.10

8,146

121

M&I Resources (17)

1,233

6.6

0.10

8,146

121

Inferred Resources (17)
2,163
7.1
0.06
15,364
134

Sulfide

Tons (000)Silver (oz/ton)Gold (oz/ton)Lead %Zinc %Copper %Silver (000 oz)Gold (000 oz)Lead (Tons)Zinc (Tons)Copper (Tons)

Measured Resources (17)

Indicated Resources (17)

1,164

5.3

0.01

2.0

3.1

1.3

6,211

15

23,500

35,900

15,240

M&I Resources (17)

1,164

5.3

0.01

2.0

3.1

1.3

6,211

15

23,500

35,900

15,240

Inferred Resources (17)

326

4.3

0.01

1.7

1.7

0.9

1,388

4

5,680

8,420

3,090

Note: All estimates are in-situ. Resources are exclusive of reserves.

(17) Mineral resources for underground zones at San Sebastian reported at a cut-off grade of $158.8/ton ($175/tonne), open pit resources reported at a cut-off grade of $72.6/ton ($80/tonne); Metallurgical recoveries based on grade dependent recovery curves: recoveries at the mean resource grade average 89% for silver and 84% for gold for oxide material and 85% for silver, 83% for gold, 81% for lead, 86% for zinc, and 83% for copper for sulfide material. Resources reported at a minimum mining width of 8.2 feet (2.5m) for Middle Vein, North Vein, and East Francine, 6.5ft (1.98m) for El Toro, El Bronco, and El Tigre, and 4.9 feet (1.5 m) for Hugh Zone and Andrea.

Rock Creek

Noxon, Montana

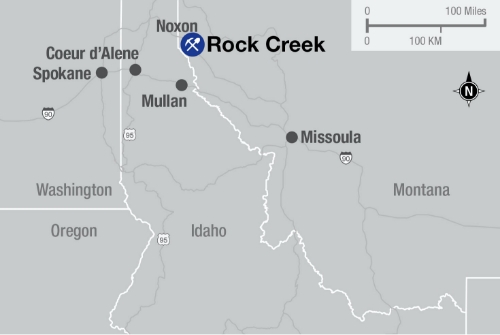
Hecla acquired the Rock Creek project in June 2015 with the acquisition of Revett Mining Company. The Rock Creek project is located approximately five miles northeast of Noxon, Sanders County, Montana (about 50 miles north of the Lucky Friday mine in Idaho).

Map of Rock Creek.

Resources

Information with respect to Inferred Mineral Resources is set forth below.

Mineral Resources
(As of December 31, 2024 unless otherwise noted)

Tons (000)

Silver (oz/ton)

Copper (%)

Silver (000 oz)

Copper (Tons)

Inferred Resources (12,27)

99,997
1.5
0.7
148,688
658,410

Note: All estimates are in-situ. Resources are exclusive of reserves.

(12) Mineral resources are based on $2,000/oz gold, $24/oz silver, $1.15/lb lead, $1.35/lb zinc and $4/lb copper, unless otherwise stated.

(27) Inferred resource at Rock Creek reported at a minimum thickness of 15 feet and an NSR cut-off value of $31.50/ton; Metallurgical recoveries: 88% for silver and 92% for copper. Resources adjusted based on mining restrictions as defined by U.S. Forest Service, Kootenai National Forest in the June 2003 ‘Record of Decision, Rock Creek Project’.

Libby Exploration Project

Libby, Montana

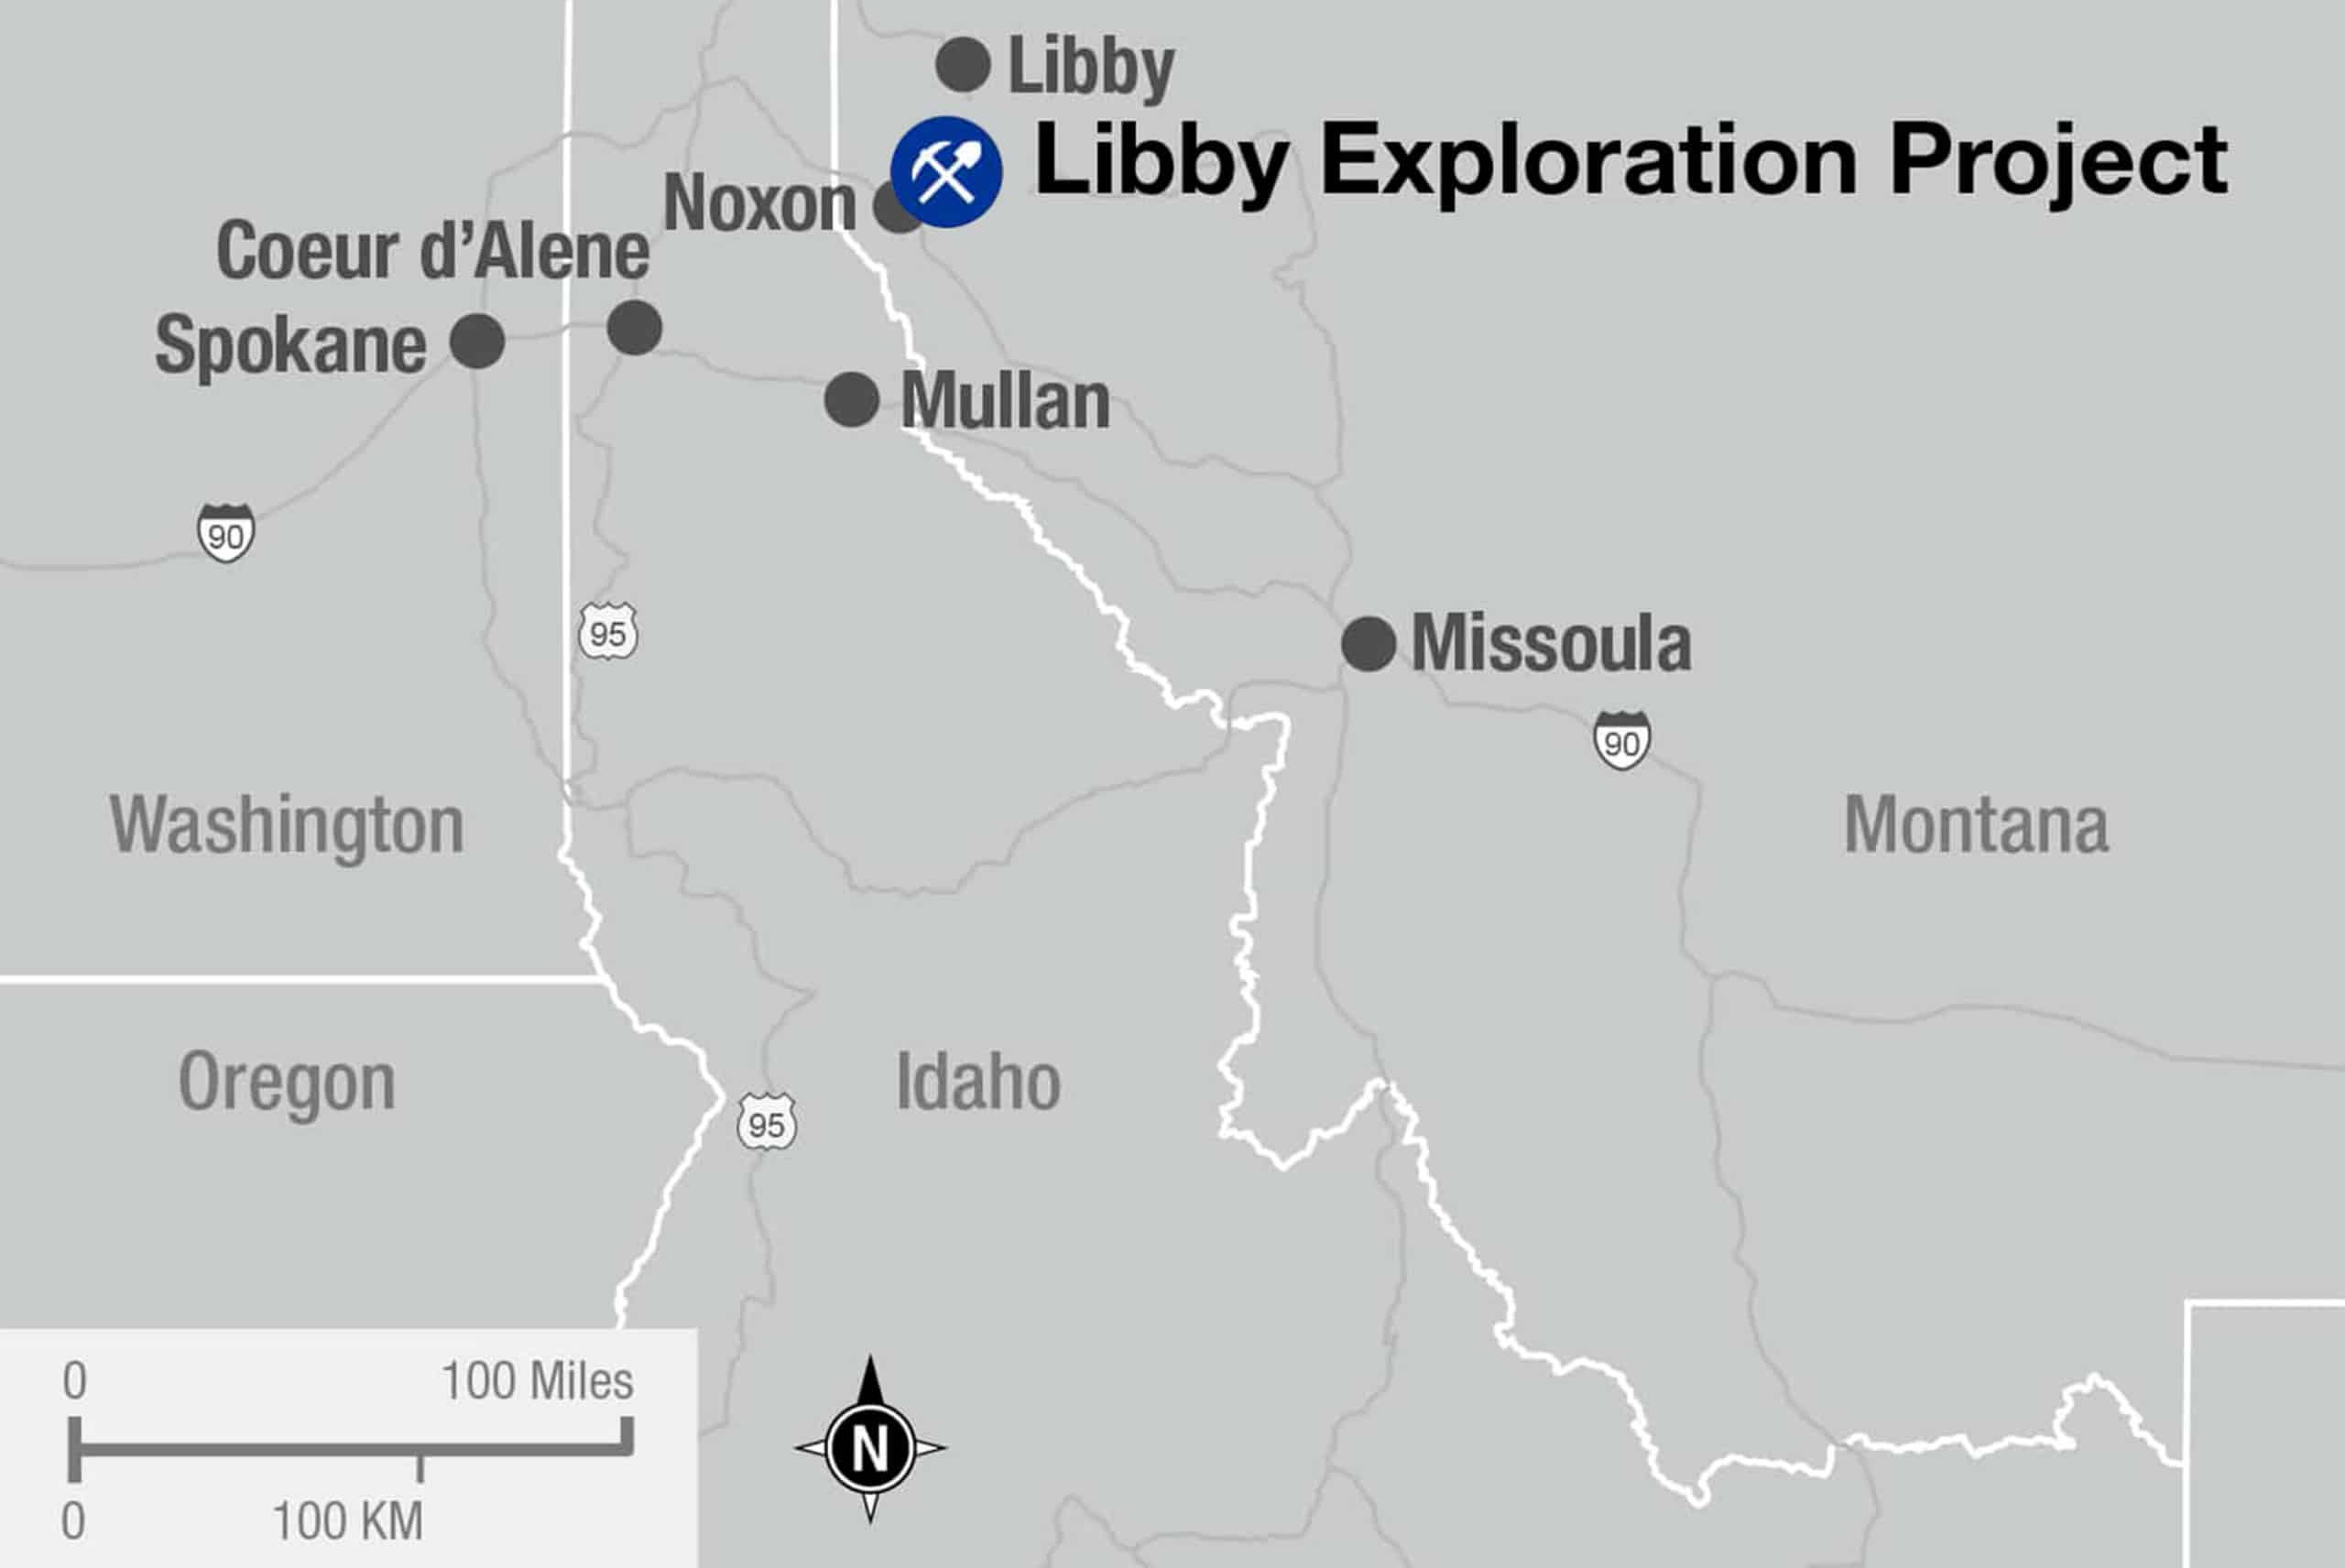
Hecla acquired the Libby Exploration (Montanore) project in September 2016 with the acquisition of Mines Management Inc. The project is located approximately 23 miles south of Libby, Lincoln County, Montana (about 50 miles north of the Lucky Friday Mine in Idaho.

Geologically, the deposit is categorized as a stratabound sediment-hosted silver-copper deposit, and is one of three major deposits in the area, including the Troy Mine and Rock Creek deposit.

Libby Exploration Project mining site on a map

Future Plans – Permitting

A new Plan of Operations for the Libby Exploration project limited to underground exploration and evaluation activities was submitted to the U.S. Forest Service and is currently under an Environmental Assessment review (“EA”) under the National Environmental Policy Act (“NEPA”). Upon successful completion of the EA process under the NEPA, and if subsequent data collection and analysis activities suggest development of a mine is feasible, then it is anticipated that a new Plan of Operations for the construction and development of a mine at the Libby Exploration site would be submitted for approval.

Resources

Information with respect to Inferred Mineral Resources is set forth below.

Mineral Resources
(As of December 31, 2024 unless otherwise noted)

Tons (000)

Silver (oz/ton)

Copper (%)

Silver (000 oz)

Copper (Tons)

Inferred Resources (12,28)

112,185
1.6
0.7
183,346
759,420

Note: All estimates are in-situ. Resources are exclusive of reserves. Totals may not represent the sum of parts due to rounding.

(12) Mineral resources are based on $2,000/oz gold, $24/oz silver, $1.15/lb lead, $1.35/lb zinc and $4/lb copper, unless otherwise stated.

(28) Inferred resource at Libby reported at a minimum thickness of 15 feet and an NSR cut-off value of $31.50/ton NSR; Metallurgical recoveries: 88% for silver and 92% copper. Resources adjusted based on mining restrictions as defined by U.S. Forest Service, Kootenai National Forest, Montana DEQ in December 2015 ‘Joint Final EIS, Montanore Project’ and the February 2016 U.S Forest Service – Kootenai National Forest ‘Record of Decision, Montanore Project’.

Rackla

Yukon, Canada

  • Dual Deposits: Osiris (700 Koz gold M&I Resource) – rare Carlin-type system outside Nevada; Tiger (464 Koz gold M&I Resource) – Carbonate Replacement deposit
  • Massive Scale: 650+ square miles with multiple mineralization styles and strongly mineralized prospects
  • Strategic Timing: Desktop review in 2025, with comprehensive exploration program planned for 2026
  • Multiple Targets: Full pipeline of prospects at various stages of advancement
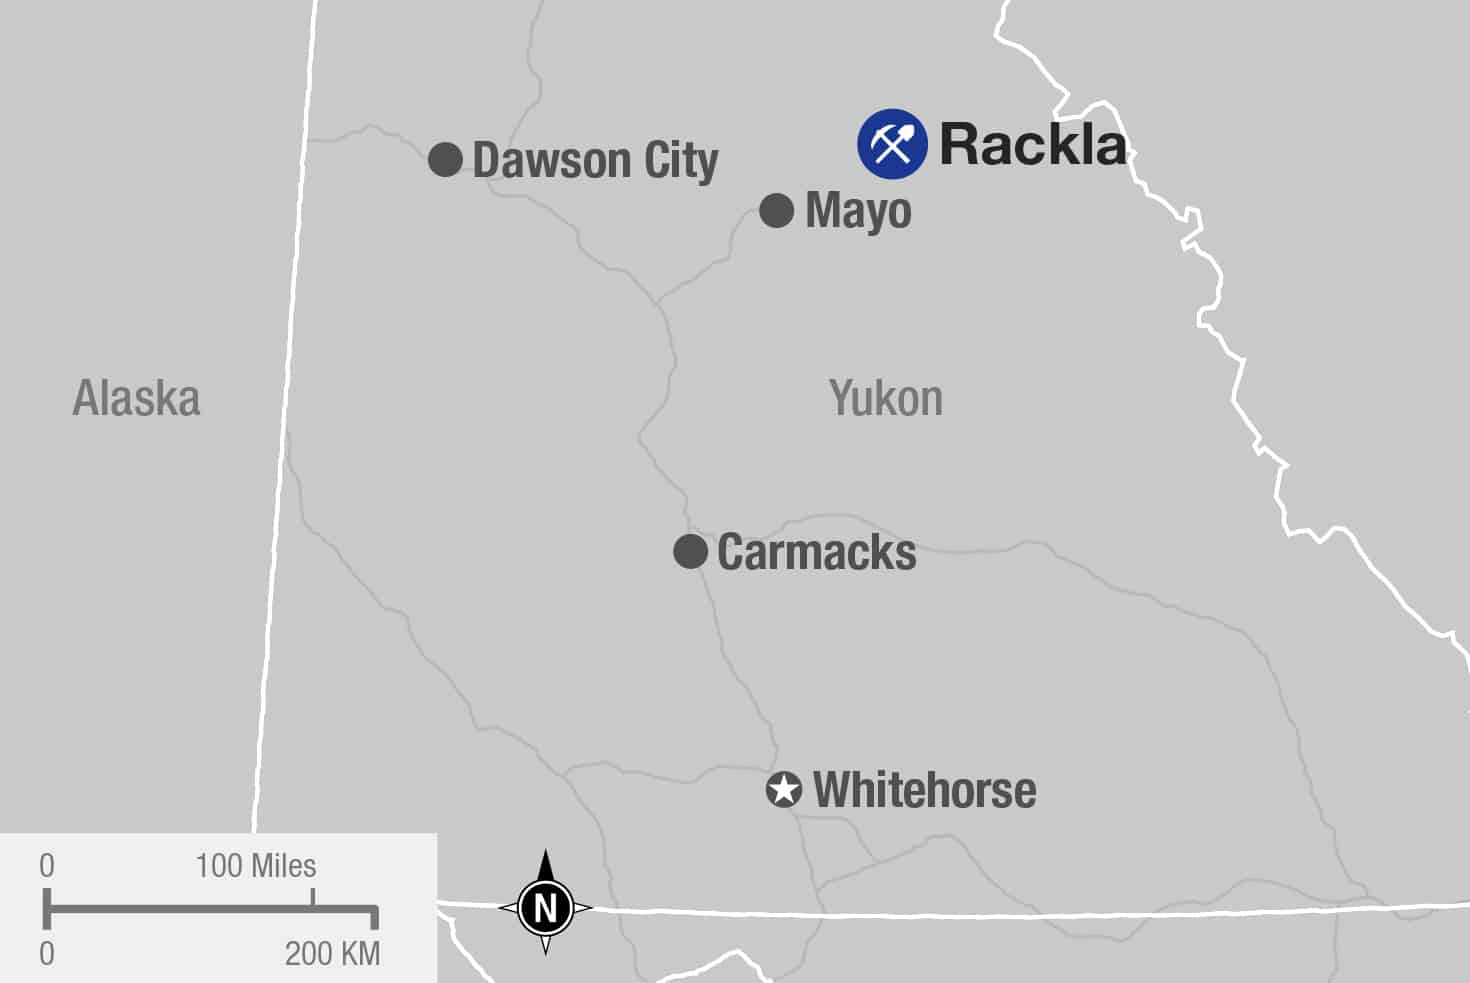
Rackla mining site on a map

Resources

Information with respect to Inferred Mineral Resources is set forth below.

Mineral Resources
(As of December 31, 2024 unless otherwise noted)

Tons (000)

Silver (oz/ton)

Gold (oz/ton)

Lead (%)

Zinc (%)

Silver (000 oz)

Gold (000 oz)

Lead (Tons)

Zinc (Tons)

Tiger Underground

Measured Resources (29)

32

0.06

2

Indicated Resources (29)
960

0.08

76

M&I Resources (29)

991

0.08

78
Inferred Resources (29)
153
0.07
11

Tiger Open Pit 

Measured Resources (29)
881

0.09

Indicated Resources (29)
3,116

0.10

311

M&I Resources (29)
3,997

0.10

386

Inferred Resources (29)
30
0.05
2

Osiris Underground 

Measured Resources (30)

Indicated Resources (30)

927

0.13

123

M&I Resources (30)

927

0.12

123
Inferred Resources (30)
4,398
515
Osiris Open Pit 

Measured Resources (30)

Indicated Resources (30)

4,843

0.13

577

M&I Resources (30)

4,843

0.10

577

Inferred Resources (30)

5,919

0.09

529

Totals may not represent the sum of parts due to rounding.

(29)
Mineral resources at the Rackla-Tiger Project are based on a gold price of $1,650/oz, metallurgical recovery of 95% for gold, and cut-off grades of 0.02 oz/ton gold for the open pit portion of the resources and 0.04 oz/ton gold for the underground portions of the resources; US$/CAD$ exchange rate: 1:1.3.

(30) Mineral resources at the Rackla-Osiris Project are based on a gold price of $1,850/oz, metallurgical recovery of 83% for gold, and cut-off grades of 0.03 oz/ton gold for the open pit portion of the resources and 0.06 oz/ton gold for the underground portions of the resources; US$/CAD$ exchange rate: 1:1.3.